
Two types of PONDR® accuracies will be discussed. The first is the accuracy obtained during
predictor training. The second is the accuracy observed when
validating the predictor on out-of-sample data. If these two accuracies agree for all sets of out-of-sample data, the predictor is said to generalize well. As an example, the training of VL-XT is discussed here, since it is the most studied and characterized of the PONDR®
algorithms.
There follows a brief discussion of improving accuracy as disorder
prediction length increases. Finally a brief discussion of two
sources of error is given, with a prominent example.
During development of the algorithms, overtraining can be a problem. Overtraining of the NNP leads to memorization of the data by the NNP, rendering the algorithm useless. To avoid this, the following procedure was used. During training, only four-fifths of the data was used. The algorithm was periodically tested against the remaining 1/5 of the data. When the accuracy on the training set (the 4/5) matched that on the test set (the 1/5), the training was halted. This training was repeated 3 different times with different starting conditions. Then a different 1/5 of the data was held out as the test data and the process was started over. This was done a total of 5 times, yielding 15 predictors. (This method is called "5-cross validation".) The training accuracy of VL1 over these 15 cycles was 83 ± 3%. Finally, to generate one predictor to replace the 15 made during training, the data was merged and a new predictor was trained to the same level of accuracy (Romero et al., 2001).
In a similar manner, the training accurracies of the XN and XC predictors reached 75%, but varied by the position in the sequence (Li et al., 1999). The two single predictors, XN and XC, were developed by merging the data and training to the same levels of accuracy, just as above.
The generalized accuracy of the predictors may be assessed by looking at their false positive and false negative rates.
|
|
False positive means that the predictor indicates "disorder" when the residue or region is known to be ordered. |
|
|
False negative means that the predictor indicates "order" when the residue or region is known to be disordered. |
To measure these rates, the PONDR® algorithms were allowed to predict on two sets of out-of-sample data:
|
|
one nominally containing entirely ordered protein (for false positive rates)
|
||
|
|
one nominally containing entirely disordered protein (for false negative rates)
|
The results (on a per-residue basis) are summarized below.
| PONDR® | False Negative |
False Positive |
5-cross Validation |
|---|---|---|---|
| VL-XT | 40% | 22% | 75 - 83% |
| XL1 | 62% | 19% | 73±4% |
| CaN | 39% | 34% | 83±5% |
Of the three predictors, VL-XT is the most accurate. It has a 78% success rate on predicting order, in good agreement with the training accuracy of 75 - 83%. It has a 60% success rate on predicting disorder which suggests that it does not generalize well. However, note that both VL-XT and XL1 were trained to recognize long regions of disorder (> 39 residues, see
below).
XL1 is as accurate as VL-XT on predicting order, but is worse at predicting disorder.
CaN does not generalize well at all, showing poor out of sample accuracy, but in some cases the contrast of its output with other predictors provides insight into binding regions of disordered sequences (Garner et al. 1999).
It is important to realize that the above table shows accuracies on a per-residue basis. As prediction length (L) increases, the accuracy of the prediction increases dramatically, as the following table shows for VL-XT. (This particular algorithm is the most studied.) Note the sharp drop in the prediction errors as the length of the prediction increases. This is why we recommend focusing on long disorder predictions.
| Minimum Number of Consecutive Predictions of Disorder ( = L ) |
False Positive per Residue |
|---|---|
| 1 | 20.1% |
| 10 | 15.4% |
| 20 | 8.3% |
| 30 | 3.9% |
| 40 | 1.7% |
| 50 | 0.5% |
| 60 | 0.1% |
| False positive rates as a function of minimum disordered region length. This summary comes from predictions made on the August 1999 O_PDB_S25 set. These results differ slightly from the published data (Romero et al., 2001 and Dunker et al., 2001) because a different procedure was used for error calculation. The estimation used previously was "percentage of sequence windows, with length equal to L, that are falsely predicted to be disordered." In this table, the error estimate is "percentage of residues in predicted disordered regions of length greater than or equal to L that are falsely predicted to be disordered." Notice that the false positive rate decreases dramatically for increasing length of predicted disorder. |
There are several potential sources for prediction error. We will discuss two of them here. First, absolute assignment of residues in the training sets to be ordered or disordered is
difficult, especially for the ones assigned to be disordered. Second, many protein regions in the PDB database classified as ordered are involved in protein-protein or protein-nucleic acid interactions or complexes (for example, see figure below). However, these same regions are disordered in the absence of their partners. By our
definition, such regions should be classified as disordered, instead of as ordered in PDB. Both of these error sources lead to noisy data, which contributes to the observed error rates.
One example of this second source of error is the oligomerization domain of the tumor suppressor p53 (see the below figure). Even though this region is shown as ordered in PDB, our PONDR® algorithm predicts portions to be disordered. Specifically the C-terminal helix and a portion of the beta sheet immediately upstream of that helix are predicted to be disordered (the red portions in the below figure). Disorder in the monomers is one explanation for how this interweaving fold could occur when the monomers interact (undergoing a disorder-to-order transition).
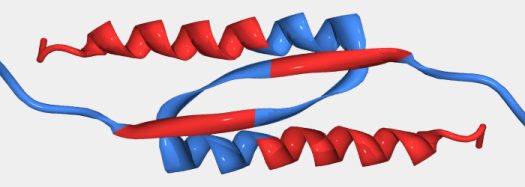
Structure of tumor suppressor p53 oligomerization domain (PDB entry 3SAK). This representation includes only one pair from the tetramer present in the NMR structure. PONDR® predicted disorder and order is represented by red and blue ribbons, respectively. PONDR® predicts the carboxyl terminal helix and a portion of the beta sheet to be disordered.
A further discussion of sources of error (including mis-classification in both directions) can be found in Li et al., 2000.
Dunker AK, Lawson JD, Brown CJ, Williams RM, Romero P, Oh JS, Oldfield CJ, Campen AM, Ratliff CM, Hipps KW, Ausio J, Nissen MS, Reeves R, Kang C, Kissinger CR, Bailey RW, Griswold MD, Chiu W, Garner EC, and Obradovic Z. (2001) Intrinsically disordered protein, J. Mol. Graphics and Modeling, 19, 26-59.
Garner E, Guilliot S, Dunker AK, Romero P, and ObradovicZ. (1998) Predicting long disordered regions in protein from amino acid sequence, Biophysical Journal, 74, Part 2 of 2: A1 - A452.
Li X, Romero P, Rani M, Dunker AK, Obradovic Z. (1999) Predicting protein disorder for N-, C- and internal regions, Genome Informatics, 10, 30-40.
Li X, Obradovic Z, Brown CJ, Garner EC, Dunker AC. (2000) Comparing predictors of disordered protein, Genome Informatics, 11, 172-184.
Romero P, Obradovic Z, Li X, Garner E, Brown C, and Dunker AK. (2001) Sequence complexity of disordered protein, Proteins: Struct. Funct. Gen., 42, 38-48.
|
 |
Copyright © 2002, 2003 Molecular Kinetics, Inc., all rights reserved.
Access to PONDR® is provided by Molecular Kinetics (6201 La Pas Trail - Ste 160, Indianapolis, IN 46268;
www.molecularkinetics.com;
main@molecularkinetics.com) under license from the WSU Research Foundation.
PONDR® is copyright ©1999 by the WSU Research Foundation, all rights reserved.
Molecular Kinetics, Inc., Washington State University and the WSU Research Foundation and their several employees and consultants assume no liability, either real or implied, from the use of PONDR® in any of its forms or the results of its predictions for any damage, loss of time, loss of profit, either real or potential, or any other damage or loss that may arise from the use of PONDR® in any of its forms or from the results of its predictions. Last updated: Jan. 12, 2007.
![]()